


Evaluate Weld Quality at a Glace

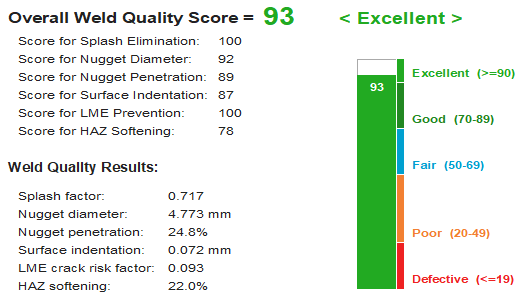
A single weld can meet nugget diameter requirements yet still suffer from expulsion, weak joining, excessive indentation, or poor fusion quality.
The Weld Quality Radar Chart provides a comprehensive visual assessment of weld performance, enabling engineers to evaluate multiple quality aspects simultaneously.
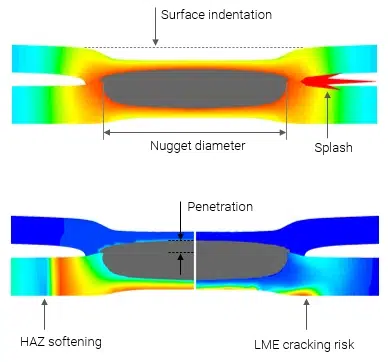
1. Splash severity
2. Nugget diameter
3. Nugget penetration
4. Surface indentation
5. LME craking risk
LME (Liquid Metal Embrittlement) cracking can reduce weld durability and fatigue performance by creating surface defects. Minimizing LME susceptibility is therefore an important objective when optimizing spot welding parameters for Zn-coated AHSS.
6. Softening in HAZ
Hardness distribution after welding is an important indicator of metallurgical changes within the weld and heat-affected zone (HAZ). Excessive softening can reduce load-carrying capability, making hardness evaluation valuable for optimizing the cooling rate.
Hardness Distribution
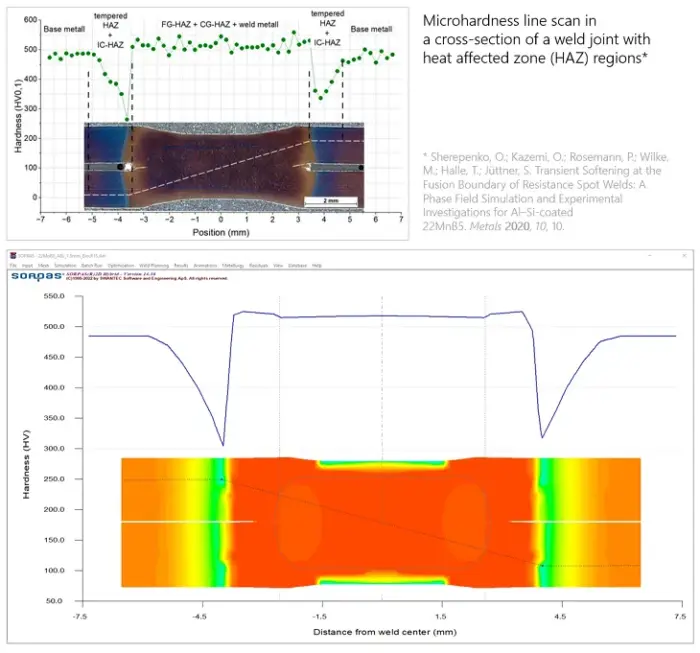
Hardness distribution represents the final hardness state of the weld after all phase transformations are completed. It provides insight into the metallurgical characteristics of the weld nugget, HAZ, and surrounding base material.
Hardness Curve
The hardness curve shows the hardness variation across the weld section and is commonly used to identify HAZ softening. It serves as an important indicator of the metallurgical effects of welding conditions and post-weld cooling behavior.
Reference publication
- Experimental hardness measurements used for comparison are reported in: Transient Softening at the Fusion Boundary of Resistance Spot Welds: A Phase Field Simulation and Experimental Investigations for Al–Si-coated 22MnB5
Weld Strength
Weld strength ultimately determines the performance of a weld joint. Although it is not one of the six quality indicators evaluated in SORPAS® 2D.Welding, the software predicts the expected weld strength from the final weld characteristics.
To further investigate joint behavior under mechanical loading, users can extend the analysis in SORPAS® 3D.Testing, where virtual testing simulations provide deeper insight into strength and failure mechanisms.